
An empirical analysis into the cause of the widening productivity compensation gap. We will show that multiple variables effect the gap with statistical significance such as capital per worker, labor share, union participation, technology increase, and changes in the consumer price index. All of these variable will be shown to effect the gap, each to their own degree. Through three models we will show the impact of these independent variables on the dependent variables, labor productivity gap, labor output, and labor compensation.

I. Introduction
In an attempt to seek out and define the significance of contributing factors to the productivity wage gap, we will assess the independent variables through sound economic theory and formulate a linear model to create a better understanding of what effects the gap between wages and labor productivity.Starting in the early 1970’s the difference between the productivity of labor and its real hourly compensation has continued to increase where labor productivity is rising and wages are increasing at a lower rate. This has created a wage productivity gap that has only grown at an increasing rate since 1982. The effects can be seen market wide however the largest sector specific gap occurs in the manufacturing sector where automation has decreased demand for labor.
We will discuss the effects of multiple variables on this widening gap. Labor share and its influence on the compensation of labor, similarly union participation rates and their effect to the bargaining power of the labor force. We will also discuss the impact of technology on this gap, more specifically the development of computers and their effect on increased productivity. Inflation will be taken into account throughout the whole model by using both implicit and explicit measures of price levels. Recessions are grayed in the visual below.

II. Literature Review
Previous literature in this area suggests that the gap is a good way to display the proportion of benefit the employed receive from economic growth. As productivity growth is a measure of living standards and real hourly compensation is a measure of purchasing power. In a review by Fleck (2011) it is stated that the measure of labor productivity is largely in effect to the increase in capital investment as well as information technology. These two influence the productivity of labor by allowing fewer resources to be used to create the same amount of goods. Another point brought up by Fleck is that companies are hiring high skilled workers. Typically as labor productivity increases there is more margin for compensation at the firm level, theoretically this should allow for the real wages to increase with productivity, but there is a lag in wages. In the Recardian model the relative price of a good is proportional to the relative price of the factor used intensively in making the good. Therefore the relative price of labor or real wages should be proportional to the relative price of the good, however it would seem this is not the case as if it were, labor productivity would increase proportional to the real wage rate Dornbusch (1977)[1]. It is stated by Fleck (2011) that some of the magnitude of this gap could be miss represented through differing means of compensating for inflation. This is done by the bureau of labor statistics by using the consumer price index and implicit price deflator. This would affect the gap, for example, if the sell prices of goods rise faster than the production prices of those goods creating an increase in productivity with a less than proportional increase in compensation in the short run. Another issue brought to light by Fleck is that labor share, a measure of how much of the earnings go to workers, can affect the gap weather it is increasing consistent or diminishing. If increasing or consistent the labor share will see that workers benefit from economic growth, where as if the labor share is diminishing then the compensations gap will increase as workers are receiving less of their input value as compensation[2]. Lawrence Mishel (2012) states that the gap is due partly to policy and the labor share margin. As prior to the 1970’s there was a proportional increase in both labor and productivity. However post World War II the gap begins to increase as the productivity of labor is rising as an increasing rate allowing for the economy to support higher wages, but the economy does not support higher wages. This means that workers are not benefiting from economic growth as they continue to produce more using less resources, they also continue to produce more for less labor share. The corporation has a growing profit margin while the worker has a shrinking labor share. Furthermore this effect has only escalated in an increasing fashion since 1970 meaning that today the labor share is diminishing, and corporate profit margins are increasing tenfold what they were in 1970.
From 1970 to 2010 productivity grew 80.4% and average hourly compensation rose only 39.2% in the same time period. This is a high estimate of average as over the same time period income distribution became more and more lopsided. None the less this means that in the span of 40 years there an increase in profitability by 80.4% and an increase in labor share of 39.2% leaving a 40% gap in the labor share the economy should be able to supply and the actual labor share that the economy is supplying. It is also important to note that the inequality of wages has increased from 1970 to 2010 as the income distribution has skewed toward the high class. This distribution is likely correlated to the increase in profit margins that have been exploited even further by not supplying labor with a proportional relative compensation[3]. Considering the impact of 40% change in 40 years, the separation of productivity and compensation has increased by 1% each and every year. While the increase in this gap varies, it doesn’t do so by much. If we use linear trend lines to fit the data we get a .98 and a.93 R2 value meaning that there is a very good fit of a linear line to the actual data. This also means that with reasonable certainty we can project there to be an 80% difference in the productivity of labor and the real hourly compensation of labor by 2050 if the same practices stay in place[4]. Smulders (1992) [5], states the distribution of income across the population is capable of impacting the mean wages of the population as a whole. As more and more of the income is focused in the top tier of the population there becomes an offset to the mean hourly compensation of the population potentially skewing the data. To account for this, extremes in high and low income will be excluded from the model in an attempt to represent the true mean wages more accurately[6].
III. Model Specification

LPRODt=β0+β1CAPITALt-β2LSHAREt+β3TECHt-β4CPIt+β5UNIONt+εt
COMPt=β0+β1CAPITALt-β2LSHAREt+β3TECHt-β4CPIt+β5UNIONt+εt
OPt=β0+β1CAPITALt-β2LSHAREt+β3TECHt-β4CPIt+β5UNIONt+εt
Where:
LPROD= Ln productivity t-Ln compensation t
OP= output /hr t
COMP= compensation/ hr t
CAPITAL= gross capital stock t
CPI=Ln CPI t-Ln IPD t
LSHARE= labor share t
UNION= union participation as % of labor force
TECH=technological increase, Moore's Law
LPROD is defined as the natural logarithm of productivity minus the natural logarithm of compensation, this is used to display the gap between the two. OP is defined as the output per labor hour and is found by taking the total output and dividing it by the labor force. COMP is defined as compensation per hour and is found by taking the total compensation and dividing it by the labor hours. CAPITAL is defined as the gross capital stock in time t divided by the employed labor force at time t. CPI is defined as the natural logarithm of CPI minus the natural logarithm of IPD, this gives a relation between the purchasing power of laborers and the labor share. LSHARE is defined as the share of profit from production given to laborers at timet. TECH is defined as technological increase from the base year of 1950, the increase in tech progress is modeled by moors law giving an exponential representation of the computing power over time. As computing power directly improves the efficiency of labor. UNION is defined as the percent of the labor force participating in a union at time t.
We hypothesize the expected coefficients to be as follows:
1. β1 if the capital per worker is increasing then this will result in an increase in the productivity gap, holding all other variables constant the sign will be positive.
2. Β2 if labor share were to decrease it would result in a decrease in compensation, resulting in an increase of the productivity gap, holding all other variables constant the sign will be negative.
3. Β3 if technology were to increase it would result in an increase in labor productivity, increasing the productivity gap, holding all other variables constant the sign will be positive.
4. β4 if the difference between the consumer price index and the implicit price deflator were to increase it would result in a decrease in the productivity gap. However if this difference were to become negative it would result in an increase in the productivity gap, holding all other variables constant the sign will be negative.
5. β5 if the union participation in the labor force were to decrease then the bargaining power of the labor force on wages would decrease relatively. Given the decrease in union participation this will result in an increase in the productivity gap, holding all other variables constant the sign will be negative.
IV. Data and Descriptive Analysis
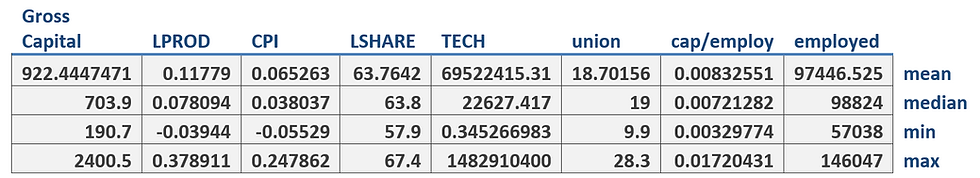
[7]The descriptive statistics for the dependent variable are as expected. The mean of all quarterly data for the natural logarithm of productivity is 5.443, with a median of 5.403. The minimum is 4.601, and the maximum is 6.024 leaving the bulk of the data within the 2nd and 3rd quartiles. As for the quarterly data for the natural logarithm of compensation, the mean is 5.287 with a median of 5.328. The minimum is 4.604 and the maximum is 5.648, again leaving the bulk of the data within the expected realm. CPI is evenly distributed as the difference between CPI and IPD are continuously less than 1 in absolute terms. LSHARE displays a consistent distribution with the bulk of the data within the second and third quartiles. TECH has an uneven distribution but this is to be expected as the function is exponential leaving the bulk of the data in the third and fourth quartiles. Union has an even distribution leaving the mean and median nearly the same, again with the bulk of the data in the expected realm. The Cap/employ is capital stock/employed labor force and as both of these variables are evenly distributed the result is distributed evenly as well.
The percentage of the labor force that is in unions has peaked and then declined in stride with the productivity gap. The gap was negative for a period of time from the late 40's to the early 60's and then began to increase. A similar pattern can be observed in the labor union participation over the same time period. As the number of laborers in unions decreases the bargaining power of the union will also decrease relative to the change. Shown below the decrease in union participation, resulting in less bargaining power for wages is correlated with the productivity gap at 92%. This negative relationship shows cause for concern when it comes to controbutional factors to the widening gap in productivity and compensation.[8]


To assess the technology that is used by laborers to produce we will use Moore's Law. This is an exponential function that expresses the number of transistors on a processing chip given the year. As the number of transistors increases the processing power of the computer increases. This will model the increase in productivity due to increase in technology, allowing workers to produce more in the same amount of time at t+1 than t 0.

The function is defined as:
Pn=Po*2(n/2)
Where:
Pn= computer processing power in future year
Po= computer processing power in beginning year
n=number of years from variable Po
Labor share is a defining variable in this model as it measures the share of production capacity owned by the laborer, or how much of the economic growth produced by the labor force is seen in the compensation of the labor force. With this we can see the effects of policy on the widening productivity compensation gap. As laws are passed by lobbied legislator’s restrictions, requirements, and regulations are often loosened to aid the ideals of those lobbying. This is an indirect measure of this effect but a measure none the less. As laws are changed to allow more profit, labor compensation decreases, this decreases the labor share.
[9]

Further changes in the capital stock can show a shockingly similar increase to the productivity gap. If we take the capital stock t and divide it by the number employed t we then have a measure of capital per worker t . Displayed as CAPITAL in the model, this is a representation of the change in the percent of capital per worker. When there is more capital investment per worker there should be an increase in productivity as theory of the firm would dictate a firm will not hire additional labor if there is not an increase in marginal product. Therefore there must be a foreseen increase in output from the firm side to cause the capital investment per worker to increase as shown below. [10]

With suspicions of serial correlation we ran a Durban-Watson d test. The results of the test are as follows:
LPROD DW stat=1.54 @5% dl=1.57 du=1.78 there is positive serial correlation
OP DW stat=.18 @5% dl=1.57 du=1.78 there is positive serial correlation
COMP DW stat=.13 @5% dl=1.57 du=1.78 there is positive serial correlation
All models will be corrected with Newey-West standard errors.
Our regressed models:
LPROD= 1.041+(.027)CPTL-(.0155)LSHARE+(2.84E-12)TECH+(.99)CPI-(1.59E-5)UNION
SE= (.07) (6.16E-5) (4.83E-13) (.002) (2.9E-5)
T-Stat= .365 -251.8 5.88 354.3 -.549
N=256 ADJ R2=.999
In this model LPROD is a measure of the gap, if capital were to increase by 1, holding all other variables constant, then the gap would increase by .027. If LSHARE were to increase by 1 then the gap would decrease by .0155. In the event that TECH increased by 1, then the gap would increase by 2.84E-12. If CPI were to increase by 1 the gap would increase by .99. Finally if UNION increased by 1, the gap would decrease by 1.59E-5.
OP= 59.51+(6315.4)CAPITAL-(.588)LSHARE-(5.1E-9)TECH-(58.4)CPI-(.487)UNION
SE= 274.8 .216 1.6E-9 10.55 .099
T-Stat= 22.97 -2.72 -3.18 -5.53 -4.9
N=257 ADJ R2=.992
In this model OP is a measure of labor output, if capital were to increase by 1, holding all other variables constant, then output would increase by 6315.4. If LSHARE were to increase by 1 then output would decrease by .588. In the event that TECH increased by 1, then output would decrease by 5.1E-9. If CPI were to increase by 1 output would decrease by 58.4. Finally if UNION increased by 1, output would decrease by .487.
COMP= 28.48+(7268.2)CAPITAL+(.297)LSHARE-(1.18E-8)TECH-(180.16)CPI-(1.25)UNION
SE= 544.9 .368 2.61E-9 20.26 .173
T-Stat= 13.3 .8 -4.52 -8.89 -7.23
N=257 ADJ R2=.972
In this model COMP is a measure of labor compensation, if capital were to increase by 1, holding all other variables constant, then compensation would increase by 7268.2. If LSHARE were to increase by 1 then compensation would increase by .297. In the event that TECH increased by 1, then compensation would decrease by 1.18E-8. If CPI were to increase by 1 compensation would decrease by 180.16. Finally if UNION increased by 1, compensation would decrease by 1.25.
V. Conclusions
While there were multiple problems with serial correlation, we conclude that these factors each play a role in the growth of the productivity compensation gap, weather through sound theory or statistical significance. The capital per worker is increasing as shown and similarly the gap itself is increasing at a near identical rate. Labor share is decreasing as the growth in the economy is not being shared with the labor force proportionately as it has been in the past. Furthermore the introduction of computers into business practice in the early 70's is what we consider to be the most likely cause in exponential productivity increase from 1970 to present. The lack of compensation to this productivity increase is likely partially effected by the decrease in union participation, leaving the labor force less able to bargain for higher wages. Concluding that the U.S. laborer is losing the ability to fight for higher wages. This is causing the compensation of workers to lag in relation to their productive capacity. Firms are giving less to their employees and getting more in return, a lot of this is the product of legislation and lax regulation, however the introduction of computers into the workplace has incredibly increased the productive capacity, no doubt increasing the profitability of corporations. Yet when the profit margins increase the labor share does not, leaving less for the labor force proportionally and more for the owners of corporations. In short, the answer to the question where does all this extra profit go? It goes to the executives, to the lobbying fund, and to the newest computing hardware. We do not foresee a change in this gap, but rather a continuance in its expansion, as it is an exploitation of the productive capacity of the labor force through capital investment in technology and persuasion in legislation; a tradition at this point with some 44 years of lineage.
I'm interested in applying AI and Data Science to world problems. If you have a research topic suggestion or would like to talk about projects please reach out! Here
VI. References
[1]Dornbusch, R., Fischer, S., & Samuelson, P. A. (1977). Comparative advantage, trade, and payments in a Ricardian model with a continuum of goods. The American Economic Review, 823-839.
[2]Fleck, S., Glaser, J., & Sprague, S. (2011). The compensation-productivity gap: a visual essay. Monthly Labor Review, 134(1), 57-69.
[3]Mishel, L. (2012). The wedges between productivity and median compensation growth. Issue Brief, 330, 26.
[4]Prescott, E., & McGrattan, E. (2012). The Labor Productivity Puzzle. In 2012 Meeting Papers (No. 644). Society for Economic Dynamics.
[5] Bls.gov
[6]Smulders, S. (1992). A theory of wealth distribution and accumulation: Mauro Baranzini,(Clarendon Press, Oxford, 1991)
[7] All data for variables 1947-2011 in appendix A.
[8] It is important to note that when union participation is at its peak in the early to late 50's the productivity compensation gap is negative, meaning that workers are getting compensated more per unit than they produce. This would clearly lead to loss in profits on the firm level.
[9] Shown in the chart labor share is slightly more sporadic than other variables. However when observed closely nearly every valley falls on a senate election year, and nearly every peak comes in the year leading up to elections. From 1980-96 this pattern ceases, only to start up again after 1996. Could this be due to a push for public support when their job is on the line, and then once secured repaying favors to those that funded their campaign, likely corporations with invested interest.
[10] This is the measure of the productivity compensation gap t overlaid with the capital stock t divided by the employed labor force t as we can see the cap/employ line is nearly an exponential trend line of the widening gap.
Comments